The great equalizer for OOH advertising has been two-fold:
1) Privacy laws and walled gardens forcing brands to measure marketing more holistically
2) Advancements in technology have leveled the playing field in terms of what's measurable for OOH
Enter Accretive Outcomes with their suite of analytics tools that enable brands to measure the impact of OOH advertising as a part of their marketing mix. The really cool part about Accretive Outcomes is that it can be used to measure:
- Website visitation and conversion for lift
- Foot traffic visitation for direct attribution
- App downloads and engagement for app-based campaign objectives
Exposed Visitation Rate vs Click-Thru Rate
The simplest way to compare how OOH measurement compares to digital advertising online is by understanding the relationship between 'Exposed Visitation Rate' and 'Click Thru Rate'. On the internet, 'Click Thru Rate' is calculated as the number of times (impressions) that an ad is served divided by the number of times it is clicked.
(Show as a formula, it would be Clicks/Impressions = Click Thru Rate)
But you can't click a billboard which is why we have 'Exposed Visitation Rate' as the means for comparing OOH ad performance to similar internet-based tactics.
The Exposed Visitation Rate is calculated as the number of website visits registered (via designated conversion pixel) relative to the size of the Total Exposed Group.
Exposed Group Size
Number of tracked consumers who were exposed to the advertising (same as Matched Users)
Exposed Website Visits
Website Visits of Exposed Group
Exposed Visitation Rate
Percentage of Exposed Website Visits and the Total Exposed Group

What's Measurable?
Know which formats in which markets are working hardest for you and create a hypothesis about how they're working together to create the maximum impact.
See things like...
- How many visits (web and store) did each inventory type contribute (and it's relative performance)
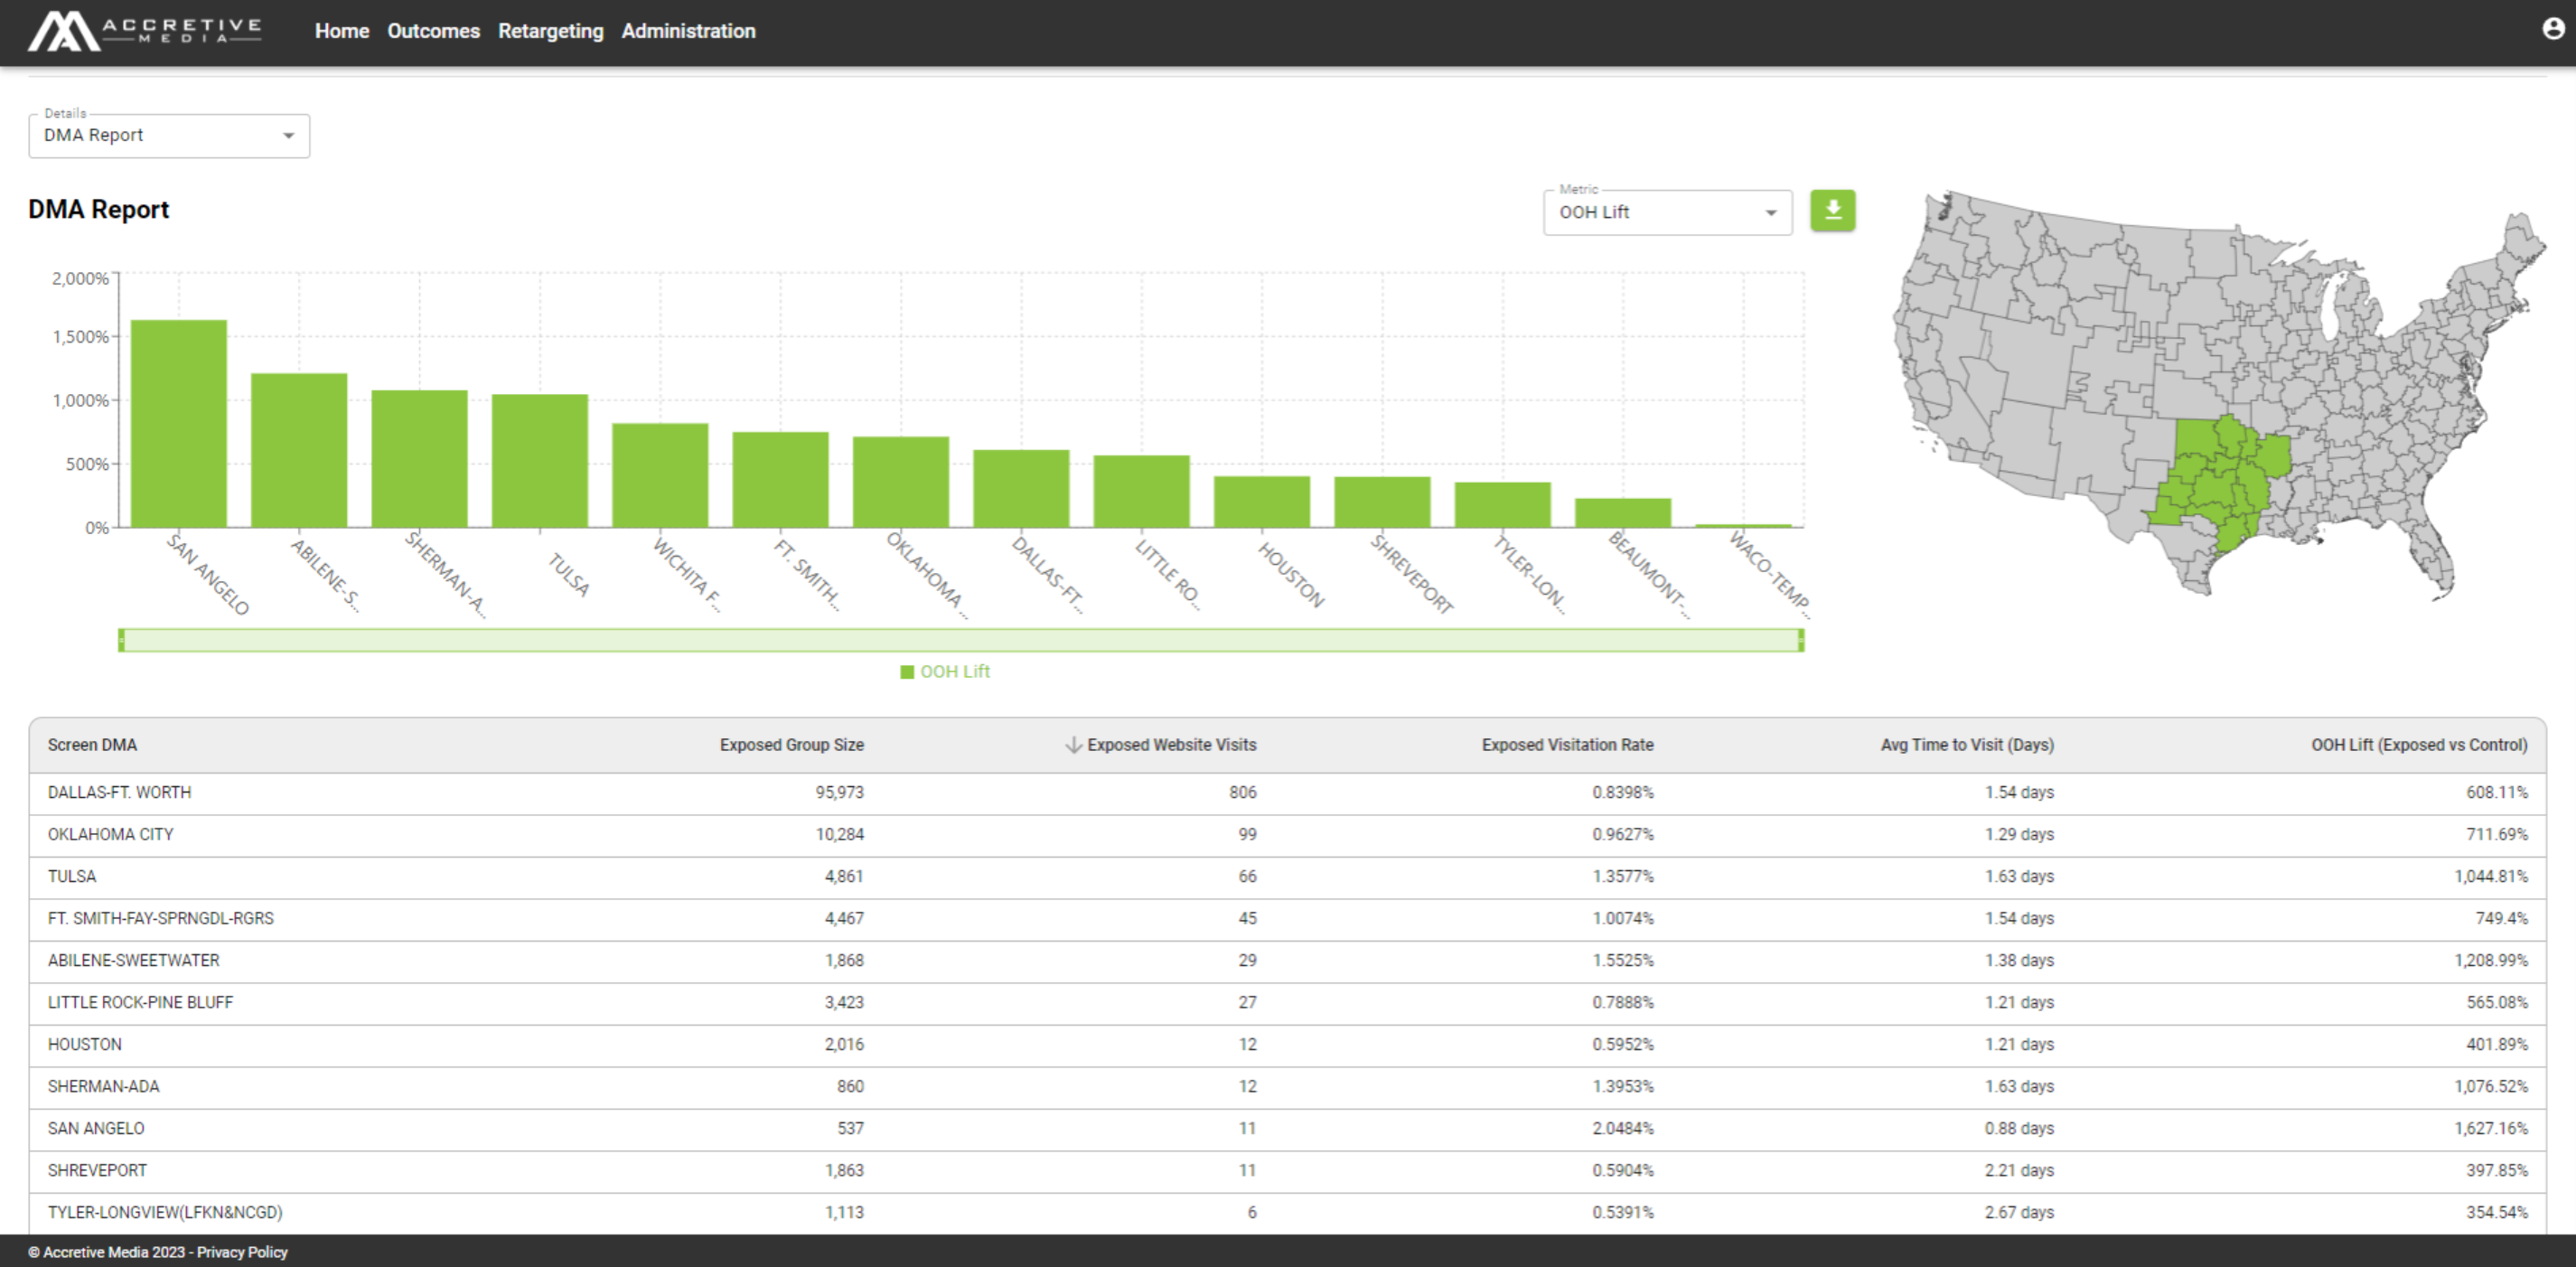
- Which DMA is responding at the highest rates and where to double down
- What markets to avoid and the underperforming parts of your campaign
How To Read It
This is the main Web Lift Report dashboard inside of the Accretive Outcomes dashboard. You're able to select from multiple advertiser accounts and campaigns, and even able to toggle your lookback windows and control groups on-the-fly.
Setup
Unique MAIDs (Trackable)
The number of total unique privacy-safe identifiers tied to mobile devices that were exposed to the advertising campaign.
Matched Users
Number of matched users in Accretive Outcomes platform.
Match Rate
Overall match rate between the unique MAIDs and our Matched Users.
Website Visits
Total website visits during the time frame (being reported on).
Unique Website Visits
Number of unique website visitors
Average Visits Per User
Average visits per user to the website (during the period being measured).
Results
Control Group Size
Number of consumers who did not see the advertising and are in the Control Group.
Control Website Visits
Website visits of Control Group.
Control Visitation Rate
Percentage of Control Group Website visits and the Total Control Group.
Avg Time to Visit (Days)
Average time for exposed users to visit the site.
Exposed Group Size
Number of tracked consumers who were exposed to the advertising (same as Matched Users).
Exposed Website Visits
Website visits of Exposed Group.
Exposed Visitation Rate
Percentage of Exposed Website Visits and the Total Exposed Group.
OOH Lift
The difference in the two visitation rates between control and exposed shows the impact of the campaign.


