Struggling to Understand Your Podcast's Performance? Here's How We Made Stats More Accurate

One of the first things I hear from newer podcasters is, "How does my podcast stack up against the rest?"
It's a natural curiosity-after all, who doesn't wonder how their hard work measures up, especially in an industry where new shows and $100m podcast deals feel like they’re popping up every day?

It's a valid concern because, while these numbers can offer insight, they can also distract from what really matters: the impact your podcast is making on your audience.
That said, we went ahead and unpacked the global stats provided by Buzzsprout and Libsyn—two of the big players in the podcast distribution world.
Whether you’re just starting out and wondering if your stats are "good enough" or you’re a seasoned host looking to gauge your growth, understanding these benchmarks can offer some valuable context, as long as we remember that the most important comparison is the one we make with ourselves.
The Misunderstanding and Clarification
Before diving into the stats, we had an important realization during our conversation. D.R. Fay revisited the numbers she originally shared and noticed a significant discrepancy between the stats from Buzzsprout and Libsyn.
Initially, it seemed like Libsyn's stats were vastly higher than Buzzsprout's. It turns out the issue was in the time frames: Buzzsprout’s stats were based on the first seven days after an episode’s release, while Libsyn’s numbers spanned a full 45 days. This difference explained the huge disparity between the two sets of stats.
Recognizing the need for a fair comparison, D.R. took it upon herself to correct this. She didn’t stop at just identifying the problem—she went a step further by using AI to create a more accurate, combined data set.
She asked ‘Claude AI' to generate a prompt that could calculate an average between the two sets of stats, normalizing them to reflect a consistent seven-day period. After inputting
I hear ya. That’s a lot. But hear me out!
This new data set provided a much clearer picture of where podcasters stand, offering benchmarks that are more accurate and fair, regardless of the platform used.
Now let’s dig into the numbers!
Buzzsprout’s Global Stats
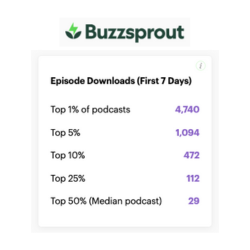
As we discussed on the show, during the month of July 2024, if your podcast is pulling in around 112 downloads in the first week of releasing an episode, you’re already in the top 25% of all Buzzsprout users.
And if you hit 472 downloads? Well, then you’re in the top 10%.
These benchmarks are particularly helpful for newer podcasters who want to understand how they measure up against others on the platform.
Libsyn’s Global Stats
On the flip side, Libsyn, being one of the oldest and most established podcast hosting platforms, offers a broader perspective.
If your show is getting over 500 downloads per episode, you’re in the top 28%, and if you’re hitting over 2,500 downloads, you’re in the top 10%.
And remember, Libsyn’s numbers are based off of episode downloads from the first 45 days vs. Buzzsprouts’ users’ first 7 days.
Here's Libsyn's breakdown*:
- Top 50%: 127+ downloads
- Top 28%: 500+ downloads
- Top 20%: 900+ downloads
- Top 10%: 2,500+ downloads
- Top 5%: 5,500+ downloads
- Top 2%: 14,000+ downloads
- Top 1%: 25,000+ downloads
*Libsyn stats provided by their podcast, 'The Feed' (episode 275)
The Combined Data Set: A New Benchmark for Podcasters
Thanks to D.R.’s work, we now have a combined data set that offers a more accurate benchmark for podcasters across both platforms. Here’s what the numbers look like when normalized to a seven-day period:
- Top 50%: 20 downloads
- Top 28%: 78 downloads
- Top 20%: 140 downloads
- Top 10%: 389 downloads
- Top 5%: 856 downloads
- Top 2%: 2,178 downloads
- Top 1%: 3,889 downloads
These combined stats provide a clearer picture of where you stand, giving you a more accurate sense of your podcast episode's performance in its first week.
With the understanding that these stats tend to change all the time, we will continue to process these two different sources together in order to come up with our final results.
Conclusion
In the world of podcasting, it’s easy to get caught up in the numbers, especially with the wealth of stats available from platforms like Buzzsprout and Libsyn. But as we discussed on The Podcasting Morning Chat, while these benchmarks can offer valuable insights, the real measure of your podcast’s success lies in the impact you’re making on your audience. Whether you’re pulling in thousands of downloads or a handful, what truly matters is the connection you’re building and the value you’re providing to your listeners.
So, as you navigate your podcasting journey, use these stats as a guide, not as a measure of your worth. Focus on growing your show, engaging your audience, and most importantly, enjoying the process.
For more of this discussion, check out episodes 143 and 144:


